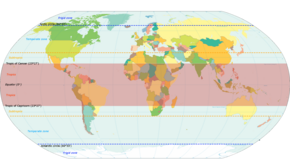
Areas of the world with subtropical climates according to Köppen climate classification
The subtropics are geographic and climate zones located roughly between the tropics at latitude 23.5° (the Tropic of Cancer and Tropic of Capricorn) and temperate zones (normally referring to latitudes 35–66.5°) north and south of the Equator.
Subtropical climates are often characterized by warm to hot summers and cool to mild winters with infrequent frost. Most subtropical climates fall into two basic types: humid subtropical, where rainfall is often concentrated in the warmest months (for example Brisbane, Queensland or Jacksonville, Florida), and dry summer climate or (Mediterranean), where seasonal rainfall is concentrated in the cooler months (for example Naples, Italy or Los Angeles, California).
Subtropical climates can occur at high elevations within the tropics, such as in the southern end of the Mexican Plateau and in Vietnam and Taiwan. Six climate classifications use the term to help define the various temperature and precipitation regimes for the planet Earth.
A great portion of the world's deserts are located within the subtropics, due to the development of the subtropical ridge. Within savanna regimes in the subtropics, a wet season is seen annually during the summer, which is when most of the yearly rainfall falls. Within Mediterranean climate regimes, the wet season occurs during the winter. Areas bordering warm oceans are prone to locally heavy rainfall from tropical cyclones, which can contribute a significant percentage of the annual rainfall. Plants such as palms, citrus, mango, pistachio, lychee, and avocado are grown within the subtropics.
Contents
1Definition
2Temperatures
3Rainfall
4Flora
5Varieties
5.1Humid variation
5.2Mediterranean climate
5.3Semi-desert/desert climate
6See also
7References
Definition
See also: List of locations with a subtropical climate
The tropics have been historically defined as lying between the Tropic of Cancer and Tropic of Capricorn, located at latitudes 23.45° north and south, respectively.[1] According to the American Meteorological Society, the poleward fringe of the subtropics is located at latitudes approximately 35° north and south, respectively.[2]
Temperatures
Tadrart Acacus desert, part of the Sahara, in western Libya.
Several methods have been used to define the subtropical climate. In the Trewartha climate classification, a subtropical region should have at least eight months with a mean temperature greater than 10 °C (50.0 °F) and at least one month with a mean temperature under 18 °C (64.4 °F).[3] German climatologists Carl Troll and Karlheinz Paffen defined Warm temperate zones as plain and hilly lands having an average temperature of the coldest month between 2 °C (35.6 °F) and 13 °C (55.4 °F) in the Northern Hemisphere and between 6 °C (42.8 °F) and 13 °C (55.4 °F) in the Southern Hemisphere, excluding oceanic and continental climates. According to the Troll-Paffen climate classification, there generally exists one large subtropical zone named the warm-temperate subtropical zone,[4] which is subdivided into seven smaller areas.[5]
According to the E. Neef climate classification, the subtropical zone is divided into two parts: Rainy winters of the west sides and Eastern subtropical climate.[6] According to the Wilhelm Lauer & Peter Frankenberg climate classification, the subtropical zone is divided into three parts: high-continental, continental, and maritime.[7] According to the Siegmund/Frankenberg climate classification, subtropical is one of six climate zones in the world.[8]
Rainfall
See also: Earth rainfall climatology, Subtropical ridge, Tropical cyclone, and Wet season
Hadley cells located on the Earth's atmospheric circulation.
Heating of the earth near the equator leads to large amounts of upward motion and convection along the monsoon trough or intertropical convergence zone. The upper-level divergence over the near-equatorial trough leads to air rising and moving away from the equator aloft. As the air moves towards the mid-latitudes, it cools and sinks, which leads to subsidence near the 30th parallel of both hemispheres. This circulation is known as the Hadley cell and leads to the formation of the subtropical ridge.[9] Many of the world's deserts are caused by these climatological high-pressure areas,[10] located within the subtropics. This regime is known as an arid subtropical climate, which is generally located in areas adjacent to powerful cold ocean currents. Examples of this climate are the coastal areas of southern Africa (Namibia, South Africa), the south of the Canary Islands and the coasts of Peru and Chile.[11]
The humid subtropical climate is often located on the western side of the subtropical high. Here, unstable tropical airmasses in summer bring convective overturning and frequent tropical downpours, and summer is normally the season of peak annual rainfall. In the winter (dry season) the monsoon retreats, and the drier trade winds bring more stable airmass and often dry weather, and frequent sunny skies. Areas that have this type of subtropical climate include Australia, Southeast Asia, parts of South America, and the deep south of the United States.[12][13][14] In areas bounded by warm ocean like the southeastern United States and East Asia, tropical cyclones can contribute significantly to local rainfall within the subtropics.[15]Japan receives over half of its rainfall from typhoons.[16]
The Mediterranean climate is a subtropical climate with a wet season in winter and a dry season in the summer. Regions with this type of climate include western Mexico.[17] the Desert Southwest of the United States,[18] Within the Mediterranean climate regime, the west coast of the United States and the Mediterranean coastline of Italy, Greece, and Turkey experience a wet season in the winter months.[19] Similarly, the wet season in the Negev desert of Israel extends from October through May.[20] At the boundary between the Mediterranean and monsoon climates in North America lies the Sonoran desert, which receives the two rainy seasons associated with each climate regime.[21]
Flora
Curitiba, Brazil: Live oak with araucarias.
These climates do not routinely see hard frosts or snow, which allows plants such as palms and citrus to flourish.[22][23] As one moves toward the tropical side the slight winter cool season disappears, while at the poleward threshold of the subtropics the winters become cooler. Some crops which have been traditionally farmed in tropical climates, such as mango, litchi, and avocado, are cultivated in the subtropics. Pest control of the crops is less difficult than within the tropics, due to the cooler winters.[24]
Tree ferns (pteridophytes) are grown within subtropical areas, primarily within the subtropics and within topography within the tropics. Dracaena and yucca can grow within the subtropics. Trees within the Taxaceae family grow within subtropical climate regimes. Apple, pear and pomegranates grow well within the subtropics.[25]
Varieties
Humid variation
Wetland Park in Hong Kong.
Main article: Humid subtropical climate
The humid subtropical climate is a subtropical climate type characterized by hot, humid summers with frequent tropical downpours of short duration and warm, and frequently dry winters. In summer, the subtropical high pressure cells bring a sultry flow of tropical air with high dew points, and daily thundershowers are typical, though brief. Normally, rainfall is concentrated in the warmest months of the year. At times, the average annual precipitation may be more evenly distributed throughout the year, or a spring maximum is present. With decreasing latitude most humid subtropical climates typically have drier winters and wetter summers.
Humid subtropical climates lie on the lower east side of continents, roughly between latitudes 25° and 35° degrees away from the equator. In the United States, the humid subtropical zone is normally considered the region from central Florida north to northeastern North Carolina.
Hong Kong
Climate chart (explanation)
J
F
M
A
M
J
J
A
S
O
N
D
25
19
14
52
19
14
71
22
17
189
25
21
330
28
24
388
30
26
374
31
27
445
31
26
288
30
26
152
28
23
35
24
19
35
20
16
Average max. and min. temperatures in °C
Precipitation totals in mm
Source: HKO
Imperial conversion
J
F
M
A
M
J
J
A
S
O
N
D
1
65
57
2
65
58
2.8
71
62
7.4
77
69
13
83
75
15
87
79
15
88
80
18
88
80
11
86
78
6
82
74
1.4
75
67
1.4
69
60
Average max. and min. temperatures in °F
Precipitation totals in inches
São Paulo
Climate chart (explanation)
J
F
M
A
M
J
J
A
S
O
N
D
239
27
19
217
28
19
160
27
18
76
25
16
74
23
14
56
22
12
44
22
12
39
23
13
81
24
14
124
25
15
146
26
17
201
26
18
Average max. and min. temperatures in °C
Precipitation totals in mm
Imperial conversion
J
F
M
A
M
J
J
A
S
O
N
D
9.4
81
66
8.5
82
66
6.3
81
65
3
77
61
2.9
73
57
2.2
71
54
1.7
71
53
1.5
74
55
3.2
75
57
4.9
77
60
5.7
79
62
7.9
79
64
Average max. and min. temperatures in °F
Precipitation totals in inches
Orlando
Climate chart (explanation)
J
F
M
A
M
J
J
A
S
O
N
D
2.4
71
49
2.4
74
52
3.8
78
56
2.6
83
60
3.5
88
66
7.6
91
72
7.3
92
74
7.1
92
74
6.1
90
73
3.3
85
66
2.2
78
59
2.6
73
52
Average max. and min. temperatures in °F
Precipitation totals in inches
Metric conversion
J
F
M
A
M
J
J
A
S
O
N
D
60
22
10
60
23
11
96
26
13
65
28
16
88
31
19
193
33
22
185
33
23
181
33
23
154
32
23
84
29
19
55
26
15
66
23
11
Average max. and min. temperatures in °C
Precipitation totals in mm
Mediterranean climate
Parc Güell, Barcelona, Spain.
Main article: Mediterranean climate
The Mediterranean climate regime resembles the climate of the lands in the Mediterranean Basin, parts of coastal southwestern North America, parts of Western and South Australia, in southwestern South Africa and in parts of central Chile. The climate is characterized by hot dry summers and cooler winters with rainfall. [26] In Europe, the northernmost mediterranean climates are found along the French Riviera, located at 43° latitude. On the immediate Atlantic coastline, the mediterranean boundary goes between Porto and Vigo at around 41° latitude. Parts of southwestern Australia around Perth have a Mediterranean climate as does areas around coastal South Africa.
Los Angeles
Climate chart (explanation)
J
F
M
A
M
J
J
A
S
O
N
D
79
20
9
97
20
10
62
21
11
23
23
12
6.6
24
14
2.3
26
16
0.3
28
18
1
29
18
6.1
28
17
17
26
15
26
23
11
59
20
9
Average max. and min. temperatures in °C
Precipitation totals in mm
Source: [1]
Imperial conversion
J
F
M
A
M
J
J
A
S
O
N
D
3.1
68
48
3.8
69
49
2.4
70
51
0.9
73
53
0.3
74
57
0.1
78
60
0
83
64
0
84
64
0.2
83
63
0.7
78
59
1
73
52
2.3
68
47
Average max. and min. temperatures in °F
Precipitation totals in inches
Perth
Climate chart (explanation)
J
F
M
A
M
J
J
A
S
O
N
D
9.5
31
18
13
31
18
19
30
16
44
26
14
118
22
11
177
19
9
170
18
8
134
19
8
81
20
10
52
23
11
22
26
14
13
29
16
Average max. and min. temperatures in °C
Precipitation totals in mm
Source: BoM[27]
Imperial conversion
J
F
M
A
M
J
J
A
S
O
N
D
0.4
87
64
0.5
88
64
0.8
85
62
1.7
78
56
4.6
72
51
7
67
47
6.7
65
46
5.3
66
46
3.2
68
49
2.1
73
52
0.9
79
57
0.5
84
61
Average max. and min. temperatures in °F
Precipitation totals in inches
Cape Town
Climate chart (explanation)
J
F
M
A
M
J
J
A
S
O
N
D
15
26
16
17
27
16
20
25
14
41
23
12
69
20
9
93
18
8
82
18
7
77
18
8
40
19
9
30
21
11
14
24
13
17
25
15
Average max. and min. temperatures in °C
Precipitation totals in mm
Source: HKO
Imperial conversion
J
F
M
A
M
J
J
A
S
O
N
D
0.6
79
60
0.7
80
60
0.8
78
58
1.6
73
53
2.7
69
49
3.7
65
46
3.2
64
45
3
64
46
1.6
67
48
1.2
70
51
0.6
74
56
0.7
77
59
Average max. and min. temperatures in °F
Precipitation totals in inches
Semi-desert/desert climate
Mount Benacantil, Alicante, Spain.
Main articles: Desert climate and Semi-arid climate
Arid subtropical climates are characterized by an annual average temperature above 18 °C (64.4 °F), the absence of regular rainfall and high humidity. Mild climate variants are generally located in areas adjacent to powerful cold ocean currents. Examples of this climate, the coastal areas of southern Africa (Namibia, South Africa), south of the Canary Islands and the coasts of Peru and Chile. [11]
Alicante
Climate chart (explanation)
J
F
M
A
M
J
J
A
S
O
N
D
22
17
6
26
18
7
26
19
8
30
21
10
33
24
13
17
27
17
6
30
20
8
30
20
47
28
18
52
24
14
42
21
10
26
18
7
Average max. and min. temperatures in °C
Precipitation totals in mm
Source: AEdM
Imperial conversion
J
F
M
A
M
J
J
A
S
O
N
D
0.9
62
43
1
64
45
1
67
47
1.2
70
50
1.3
74
56
0.7
81
63
0.2
86
67
0.3
87
69
1.9
83
64
2
76
57
1.7
69
50
1
64
45
Average max. and min. temperatures in °F
Precipitation totals in inches
Cairo
Climate chart (explanation)
J
F
M
A
M
J
J
A
S
O
N
D
5
19
9
3.8
20
10
3.8
24
12
1.1
28
15
0.5
32
18
0.1
34
20
0
35
22
0
34
22
0
33
21
0.7
29
17
3.8
25
14
5.9
20
10
Average max. and min. temperatures in °C
Precipitation totals in mm
Source: WMO
Imperial conversion
J
F
M
A
M
J
J
A
S
O
N
D
0.2
66
48
0.1
69
49
0.1
74
53
0
83
58
0
90
64
0
93
68
0
94
72
0
94
72
0
91
69
0
85
63
0.1
77
57
0.2
69
51
Average max. and min. temperatures in °F
Precipitation totals in inches
Lima
Climate chart (explanation)
J
F
M
A
M
J
J
A
S
O
N
D
0.9
26
19
0.3
27
19
4.9
26
19
0
24
18
0.1
22
16
0.3
20
15
0.3
19
15
0.3
18
15
5.4
19
15
0.2
20
15
0
22
16
0.3
24
18
Average max. and min. temperatures in °C
Precipitation totals in mm
Source: WMO
Imperial conversion
J
F
M
A
M
J
J
A
S
O
N
D
0
78
66
0
80
67
0.2
79
67
0
76
64
0
71
61
0
67
60
0
66
59
0
65
58
0.2
66
58
0
68
59
0
71
62
0
75
64
Average max. and min. temperatures in °F
Precipitation totals in inches
See also
Wikimedia Commons has media related to Subtropics.
Geographical zone
Subtropical cyclone
References
^I. G. Sitnikov. "1". Principal Weather Systems in Subtropical and Tropical Zones(PDF). 1. Encyclopedia of Life Support Systems..mw-parser-output cite.citation{font-style:inherit}.mw-parser-output q{quotes:"""""""'""'"}.mw-parser-output code.cs1-code{color:inherit;background:inherit;border:inherit;padding:inherit}.mw-parser-output .cs1-lock-free a{background:url("//upload.wikimedia.org/wikipedia/commons/thumb/6/65/Lock-green.svg/9px-Lock-green.svg.png")no-repeat;background-position:right .1em center}.mw-parser-output .cs1-lock-limited a,.mw-parser-output .cs1-lock-registration a{background:url("//upload.wikimedia.org/wikipedia/commons/thumb/d/d6/Lock-gray-alt-2.svg/9px-Lock-gray-alt-2.svg.png")no-repeat;background-position:right .1em center}.mw-parser-output .cs1-lock-subscription a{background:url("//upload.wikimedia.org/wikipedia/commons/thumb/a/aa/Lock-red-alt-2.svg/9px-Lock-red-alt-2.svg.png")no-repeat;background-position:right .1em center}.mw-parser-output .cs1-subscription,.mw-parser-output .cs1-registration{color:#555}.mw-parser-output .cs1-subscription span,.mw-parser-output .cs1-registration span{border-bottom:1px dotted;cursor:help}.mw-parser-output .cs1-hidden-error{display:none;font-size:100%}.mw-parser-output .cs1-visible-error{font-size:100%}.mw-parser-output .cs1-subscription,.mw-parser-output .cs1-registration,.mw-parser-output .cs1-format{font-size:95%}.mw-parser-output .cs1-kern-left,.mw-parser-output .cs1-kern-wl-left{padding-left:0.2em}.mw-parser-output .cs1-kern-right,.mw-parser-output .cs1-kern-wl-right{padding-right:0.2em}
^Glossary of Meteorology (25 April 2012). "Subtropics". American Meteorological Society. Retrieved 24 March 2013.
^Belda et al. Climate classification revisited: from Köppen to Trewartha. In: Climate Research Vol. 59: 1-13, 2014.
^Climatic map by Istituto Geografico De Agostini, according to Troll-Paffen climate classification Archived 4 October 2012 at the Wayback Machine.
^Die Klimaklassifikation nach Troll / Paffen – klimadiagramme.de
^Die Klimaklassifikation nach E. Neef – klimadiagramme.de
^Wilhelm Lauer & Peter Frankenberg climate classification
^Die Klimatypen der Erde – Pädagogische Hochschule in Heidelberg
^Dr. Owen E. Thompson (1996). Hadley Circulation Cell. Archived 5 March 2009 at the Wayback Machine. Channel Video Productions. Retrieved on 11 February 2007.
^ThinkQuest team 26634 (1999). The Formation of Deserts. Archived 17 October 2012 at the Wayback Machine. Oracle ThinkQuest Education Foundation. Retrieved on 16 February 2009.
^Susan Woodward (2 February 2005). "Tropical Savannas". Radford University. Archived from the original on 25 February 2008. Retrieved 16 March 2008.
^Randy Lascody (2008). The Florida Rain Machine. National Weather Service. Retrieved on 6 February 2009.
^John J. Stransky (1 January 1960). "Site Treatments Have Little Effect During Wet Season in Texas". Tree Planters' Notes. 10 (2).
^Geoffrey John Cary; David B. Lindenmayer; Stephen Dovers (2003). Australia Burning: Fire Ecology, Policy and Management Issues. Csiro Publishing. p. 33. ISBN 9780643069268. Retrieved 24 March 2013.
^Whipple, Addison (1982). Storm. Alexandria, VA: Time Life Books. p. 54. ISBN 0-8094-4312-0.
^Remote Sensing for Migratory Creatures (2002). https://web.archive.org/web/20041102070632/http://arsc.arid.arizona.edu/migratory/veg_tdf.html Phenology and Creature Migration: Dry season and wet season in West Mexico.] Arizona Remote Sensing Center. Retrieved on 6 February 2009.
^J. Horel (2006). Normal Monthly Precipitation, Inches. Archived 13 November 2006 at the Wayback Machine. University of Utah. Retrieved on 19 March 2008.
^D. Bozkurt, O.L. Sen and M. Karaca (2008). Wet season evaluation of RegCM3 performance for Eastern Mediterranean. EGU General Assembly. Retrieved on 6 February 2009.
^Ron Kahana; Baruch Ziv; Yehouda Enzel & Uri Dayan (2002). "Synoptic Climatology of Major Floods in the Negev Desert, Israel" (PDF). International Journal of Climatology. 22 (7): 869. Bibcode:2002IJCli..22..867K. doi:10.1002/joc.766. Archived from the original (PDF) on 19 July 2011.
^Michael J. Plagens (2009). What and Where is the Sonoran Desert? Arizonensis. Retrieved on 7 February 2009.
^Walter Tennyson Swingle (1904). The Date Palm and its Utilization in the Southwestern States. United States Government Printing Office. p. 11. Retrieved 24 March 2013.
^Wilson Popenoe (1920). Manual of Tropical and Subtropical Fruits: Excluding the Banana, Coconut, Pineapple, Citrus Fruits, Olive, and Fig. The Macmillan Company. p. 7. Retrieved 24 March 2013.
^Galán Saúco, V. Robinson, J. C., Tomer, E., Daniells, J. (2010). "S18.001: Current Situation and Challenges of Cultivating Banana and other Tropical Fruits in the Subtropics" (PDF). 28th International Horticultural Congress. Archived from the original (PDF) on 1 May 2013. Retrieved 24 March 2013.CS1 maint: Multiple names: authors list (link)
^R. K. Kholi; D. R. Batish & H. B. SIngh. "Forests and Forest Plants Volume II – Important Tree Species" (PDF). Encyclopedia of Life Support Systems. Retrieved 9 April 2013.
^Michael Ritter (24 December 2008). "Mediterranean or Dry Summer Subtropical Climate". University of Wisconsin–Stevens Point. Archived from the original on 5 August 2009. Retrieved 17 July 2009.
^"Perth Monthly climate statistics". Australia Bureau of Meteorology. Retrieved 2 August 2010.
constituent political entity sharing sovereignty as the United States of America U.S. State Also known as: Commonwealth (in four states) Category Federated state Location United States Number 50 Populations Smallest: Wyoming, 579,315 Largest: California, 39,536,653 [1] Areas Smallest: Rhode Island, 1,545 square miles (4,000 km 2 ) Largest: Alaska, 665,384 square miles (1,723,340 km 2 ) [2] Government State government Subdivisions County (or equivalent) A state is a constituent political entity of the United States. There are currently 50 states, which are bound together in a union with each other. Each state holds governmental jurisdiction over a defined geographic territory and shares its sovereignty with the United States federal government. Due to the shared sovereignty between each state and the federal government, Americans are citizens of both the federal republic and of the state in which they reside. [3] State citizenship and reside...
For other people named Michael Jordan, see Michael Jordan (disambiguation). Michael Jordan Jordan in 2014 Charlotte Hornets Position Owner League NBA Personal information Born ( 1963-02-17 ) February 17, 1963 (age 55) Brooklyn, New York Nationality American Listed height 6 ft 6 in (1.98 m) Listed weight 216 lb (98 kg) Career information High school Emsley A. Laney (Wilmington, North Carolina) College North Carolina (1981–1984) NBA draft 1984 / Round: 1 / Pick: 3rd overall Selected by the Chicago Bulls Playing career 1984–1993, 1995–1998, 2001–2003 Position Shooting guard Number 23, 12, [a] 45 Career history 1984–1993, 1995–1998 Chicago Bulls 2001–2003 Washington Wizards Career highlights and awards 6× NBA champion (1991–1993, 1996–1998) 6× NBA Finals MVP (1991–1993, 1996–1998) 5× NBA Most Valuable Player (1988, 1991, 1992, 1996, 1998) 14× NBA All-Star (1985–1993, 1996–1998, 2002, 2003) 3× NB...
This article is about the capital of the Czech Republic. For other uses, see Prague (disambiguation). "Praha" redirects here. For other uses, see Praha (disambiguation). Capital city in Czech Republic Prague Praha Capital city Capital City of Prague Hlavní město Praha Clockwise from top: panorama with Prague Castle, Malá Strana and Charles Bridge; Pankrác district with high-rise buildings; street view in Malá Strana; Old Town Square panorama; gatehouse tower of the Charles Bridge; National Theatre Flag Coat of arms Motto(s): "Praga Caput Rei publicae" (Latin) [1] "Prague, Head of the Republic" .mw-parser-output .nobold{font-weight:normal} other historical mottos "Praga mater urbium" (Latin) "Praha matka měst" (Czech) [1] "Prague, Mother of Cities" "Praga Caput Regni" (Latin) [2] "Prague, Head of the Kingdom" Prague Location of Prague in the Cze...